
Creating Effective User-Friendly Access to the Massive USGS Data Sets to Create Personal Workspaces
Fei Tian College and the Northern Academy, Middletown, NY USA – A World Bridge® Team
Collaborative Model for Acquiring Current and Archived USGS Data and Visualization in NASA WebWorldWind –
A World Bridge – Trillium Learning Project
This combined A World Bridge team is a collaboration of students from two academic institutions, Fei Tian College and the Northern Academy prep school.
Goal
The Fei Tian College and Northern Academy A World Bridge team is developing a web application that acquires archived USGS Data, then visualizes the layers on NASA WebWorldWind. An important project goal is to design and create a user-friendly functionality to acquire and visualize the massive amounts of USGS data. The user-friendly platform is designed for public access to USGS geospatial data, including WMS and WCS-served data. The application has been under research and development for only 4 weeks. The application will eventually allow a user to create custom workspaces, and manage the USGS layers they choose into research, presentation and demonstration environments. This app also allows the client/user to submit new custom georeferenced layers that may be added to a Geoserver, and application menu, subsequently allowing the custom layers to be viewed publicly.
The current prototype is under development on the Chrome browser, so please use that application to run the program.
Before you run the application, Please watch the Evaluaton Video (see below), which demonstrates how to use the app, and will show you as much functionality as possible within the 3-minute timeframe.
Our project development aligns with the USGS mission: “We monitor, assess and conduct targeted science research so that the policy makers and the public have the understanding they need to enhance preparedness, response and resilience. We provide science about the natural hazards that threaten lives and livelihoods; the water, energy, minerals, and other natural resources we rely on the health of our ecosystems and environment; and the impacts of climate and land-use change. Our scientists develop new methods and tools to supply timely, relevant, and useful information about the Earth and its processes.”
Click this link or the picture below to play the video. The video will stream after a pause while beginning to download, and you’ll have the option to expand the window size, You may also download the video
The Application
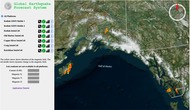
The application utilizes NASA’s WebWorldWind geospatial 3D platform – a virtual globe that allows users to search, discover and stack USGS data in layers, using links to native sources. To accomplish this, the students followed guidelines from USGS for categorizing and acquiring data layers, and NASA’s WebWorldWind SDK.
Our Process:
- Identify, categorize, and acquire USGS web-served geospatial data (maps and various data layers)
- Create a searchable index tool to find and display these data on a WebWorldWind geospatial 3D platform
- Adapt existing WebWorldWind tools to offer display options on a virtual globe
- Allow users to submit custom georeferenced data layers
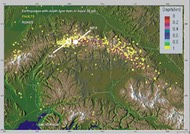
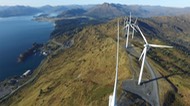
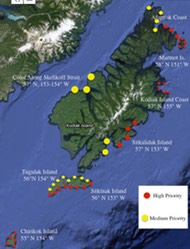
This project consists of two web applications using NASA’s WebWorldWind geospatial platform, which includes place marks, heat maps and custom user layers. Our custom layer features a unique high-definition drone imagery of the Kodiak Electric Association’s Wind Turbine site acquired by A World Bridge students located in Kodiak, Alaska. These layers can be adjusted according to the user’s objective and options for tilting and zooming to enhance their experience.
Click HERE to run the application
The application’s source code may be accessed on GitHub HERE
Educational Outreach
The UUSGS-NASA Data Visualization Project application is being designed for users with a wide range of technical understanding, to easily search, acquire and view the massive USGS data archives, in easily manageable workspaces. We are far from completing these functionalities, so the current application represents a 4-week prototype. This application’s functionalities allow for a wide range of use, from schools to universities, and also for advanced research. The NASA WebWorldWind platform is designed to communicate real-time data collections from USGS to the public in a uniquely visualized yet comprehensive form. Our prototype application features data from the National Map Services and US Wind Turbine Database and improves the public’s understanding of national geospatial data.
The USGS-NASA Data Visualization Project application is a completely open source application based on NASA-ESA WebWorldWind. Programming code utilized a variety of tools and applications, including Javascript, HTML5, CSS, Python, and server-side programming – all available on the GitHub site.
Features Overview
USGS Data Workflow
The data workflow for this project is illustrated in the graphic below. The process consists of:
1. Initial data collection and information analysis from the USGS website
2. Verification and latitude-longitude processing for each USGS location
3. Output data and/or error to data container
4. Server-side data storage and WebWorldWind layer foundation
5. Data visualization of WWW on the application, GUI functionality and client calls.
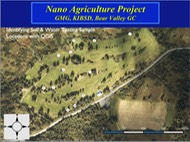
Evaluation Video Documentation – Slides from the Evaluation Video
The Evaluation video above may also be viewed as a PDF file for your review.. This slide set provides a tutorial-level view of the many features, data and documentation available in the USGS – NASA Data Visualization application, and demonstrates many details of the level of information, sophisticaton of the application, and UN data available to help manage a community’s resources.
Click on the title tezt above, or the picture to the left to view and/or download the PDF document.
Server-Side and Technical Documentation/Description
Click HERE to view a separate page on the USGS Data Visualization technical documentation.
Click HERE to see functional workflow for how a user’s actions are performed within the software.
Meet the Team
Mentor: Professor Ron Fortunato
Assistant Mentor: Mr. Anson Zhao
A World Bridge® collaborative team members include Trueman Wu, Julia L. Zhu, Amy Yin, Huaqi Zhang, Minghui Zhang, Zedong Ding, Albert Sun, Charlie Cai and Annie Sun from Fei Tian College and Northern Academy, Middletown, New York, USA.