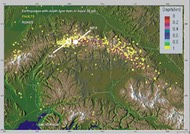


Following published studies on magnetometer precursor research, anomalies were observed in the magnetic field lasting anywhere from 100ms to 10-20sec each. It is hypothesized that these pulses are caused by pressure building in the earths crust and that these anomalies increase in number prior to an earthquake. When we first started collecting data, we were using an InteleSense platform. Its data was averaged over 15 minute spans.
A World Bridge™ Lab, Kodiak High School, Alaska
Although this did prove useful in identifying earthquake precursors, a higher sample rate was required to identify the hypothesized anomalies, so we decided to develop our own in-house sensor platforms. Early on, it was decided that our platform needed to be built on education friendly and open-source hardware and software. The first generation platform was expected to achieve a one Hertz sample rate from the magnetometer (equivalent to the InteleCell stations) and include GPS, temperature and humidity sensors for monitoring station health. All sensors are required to report to our servers in real-time.
We selected the Arduino MEGA for the processor in the original design, because Arduino is an open source platform with abundant online resources that optimized it for a developmental program. We also selected specific GPS, temperature and humidity sensors, and a high precision magnetometer.
In our current updated design, we moved to the Raspberry Pi 2 as our processor. This change was required to reach the 20 Hz sample rate necessary to properly test the hypothesis and meet NASA researchers’ requirements. The new Raspberry Pi 2 processor is now acquiring data at a 50 Hz sample rate, while the old Arduino MEGA could not support more than a 1 Hz sample rate. We also switched to a USB based GPS, while the temperature and humidity sensor magnetometer remained the same.
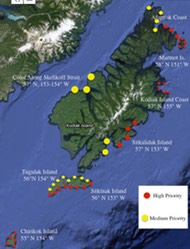
The first station sampled once every few seconds, but as we established and optimized our database, we were able to push the sampling up to twice every second, but was not stable. All 4 current ESP stations currently acquire data at 50 Hz, well beyond the NASA researchers’ requirements for data analysis. We’re continually working on reducing system size, and adding additional sensors.
As this program expands, it provides a remarkable real-time educational environment, and allows students to have their work progress at whatever speed is most comfortable, while being formally acknowledged for what they have achieved.
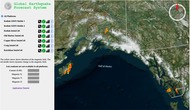
The data acquired is transmitted to our host server, stored in an Influx database, then analyzed and displayed/visualized on the WebWorldWind interface. The X, Y and Z magnetometer readings are translated into surface vectors.
ESP Server, Kodiak High School, Kodiak, Alaska
Image Descriptions and Annotations:
This is a 3-D CAD model of the circuit boards inside of the ESP Station. In the foreground you can see three circuit boards stacked on top of each other: the Raspberry Pi 2 on the bottom, the Ethernet Shield in the middle, and our custom-built board for sensors on top.
This model shows circuit boards inside of the ESP Station. In the foreground you can see three circuit boards stacked on top of each other: Raspberry Pi 2 on bottom, the Ethernet Shield in the middle, and our custom build board for our sensors on top. In the background there is the Power over Ethernet splitter.
This model is the full assembly of the ESP Station. Starting on the far left is the Power over Ethernet Injector, then the main station case, and then the magnetometer case.
This image shows the magnetometer in its case from an isometric view.
A view of the magnetometer from the side showing how it connects to the outside of the case.
This model shows circuit boards inside of the ESP Station. On the right you can see three circuit boards stacked on top of each other: the Raspberry Pi 2 on bottom, the Ethernet Shield in the middle, and our custom-built board for our sensors on top. On the left is the Power over Ethernet splitter.
This model shows circuit boards inside of the ESP Station. On the left you can see three circuit boards stacked on top of each other: the Raspberry Pi 2 on the bottom, the Ethernet Shield in the middle, and our custom-built board for the sensors on top. On the right there is the Power over Ethernet splitter. In the background are the ports connecting the magnetometer to the main board assembly and the Power injected Ethernet cable bringing power to the system.
This is showing the input for the Power Over Ethernet injector. Though the cables are not shown it would be connected to a router and a power source.
This is the output cable of the Power Over Ethernet injector, which runs both power and Ethernet data over one cable.