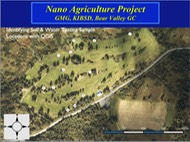
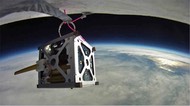
The Nanotechnology in Agriculture treatments begun last year are now being resumed. Microbes were dormant over the winter season, and are now returning to activity as the average temperatures approach the low 50 degree zone. The first Unmanned Aircraft Systems (UAS) course mapping was accomplished on Wed. May 18, 2016. Students will also conduct the first soil analysis and treatments for this year will begin on Thurs. May 26. The treatment areas will then be labeled on the following images.
The images on this page are down-sampled for viewing, however, the associated links allow raw file downloads which may be quite large, but are maximum resolution.
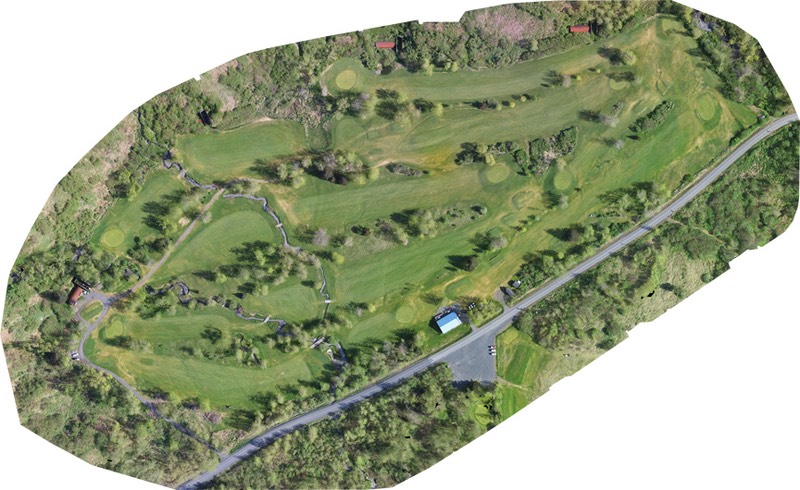
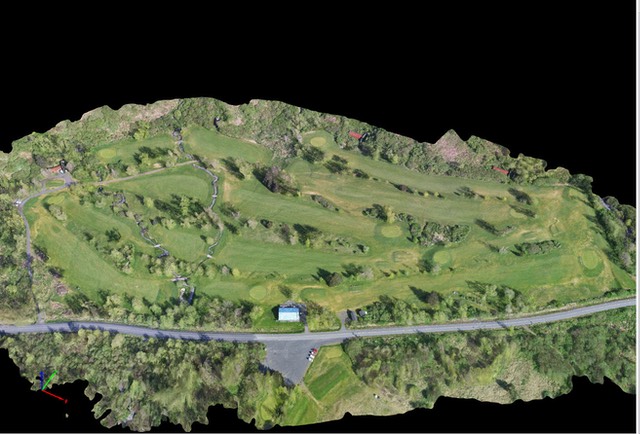
BVGC Orthomosaic May 18, 2016
This full orthorectified mosaic is composed of 208 images. The raw file may be downloaded with this link or clicking the image. Image size is 20.5 x 12.5 feet, and 292.2 MB in file storage.
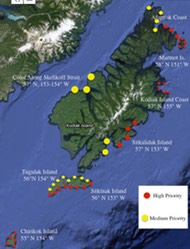
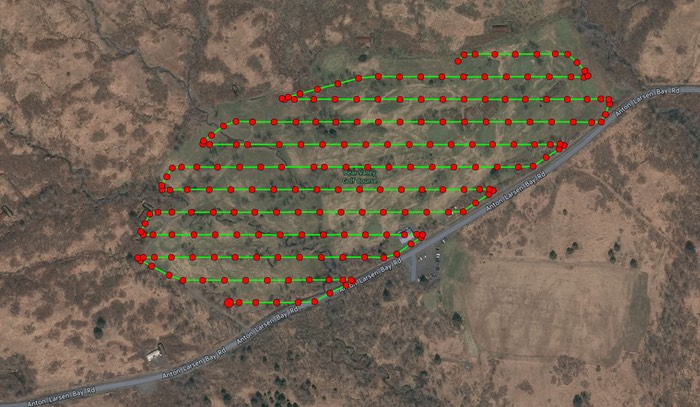
Unmanned Aircraft System (UAS) Waypoint Map
The following image represents the latitude/longitude locations for each image captured by the UAS. The green/yellow line represents the flight transects, and the red dots represent the picture capture location.
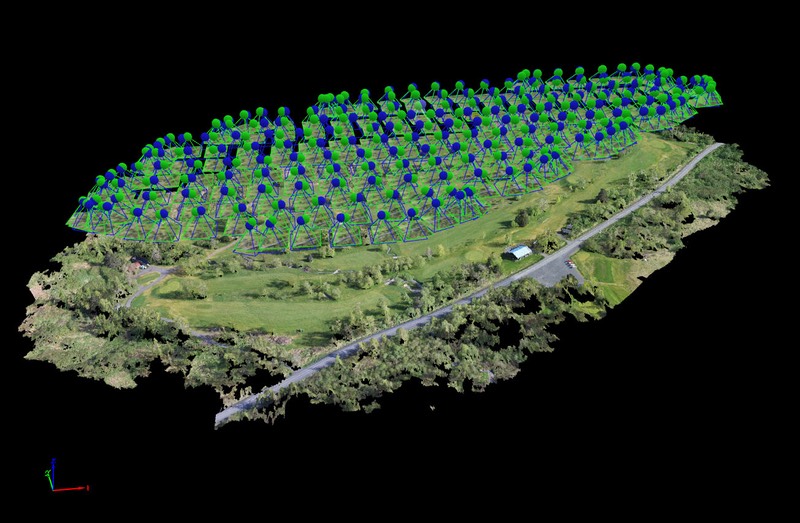
Point Cloud for Orthomosaic Rendering
The following image indicates the camera position and image footprint for each waypoint.
3D Renderings of the Orthomosaic
The following images are screencaptures of the 3D map rendering processed from the orthomosaic. A movie flythrough is also available below.
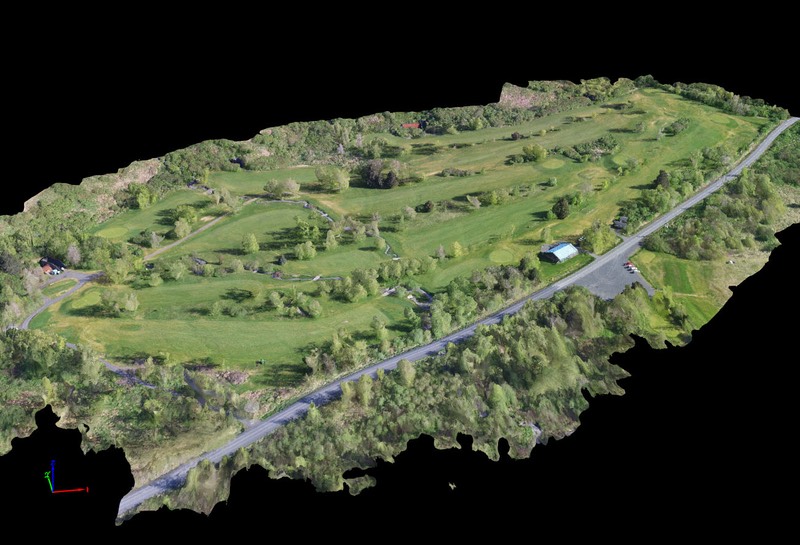
BVGC 3D Render 1
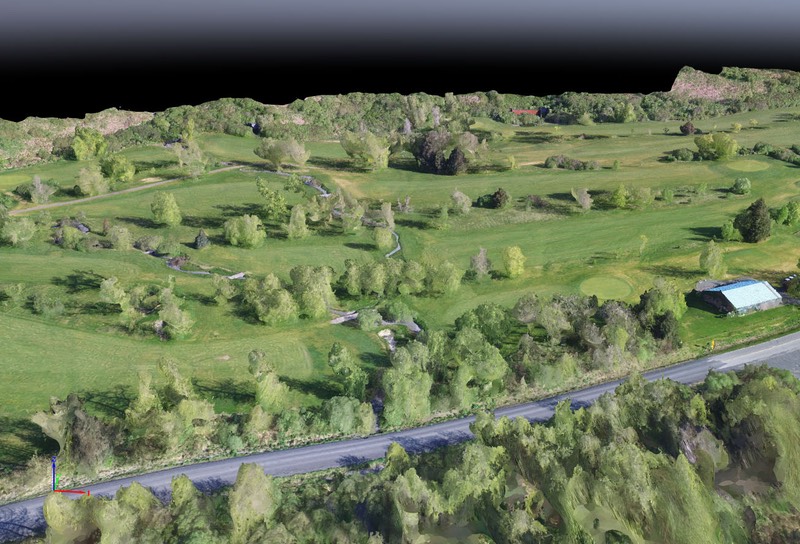
BVGC 3D Render 2
BVGC 3D Render Flythrough Movie – please allow time for download, based upon your network’s bandwidth. Just click on the image.
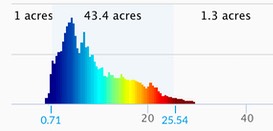
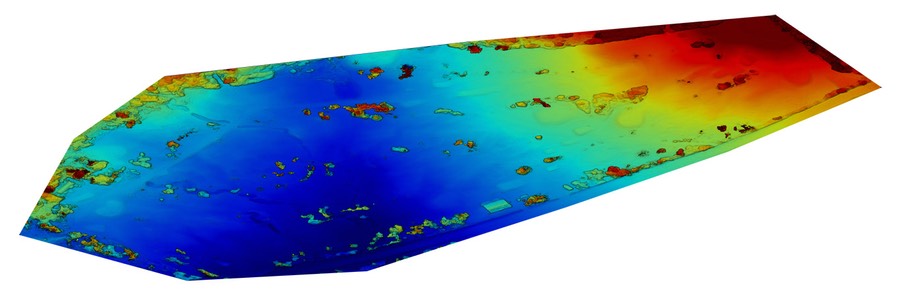
Elevation Model – Dark red is highest elevation, dark blue lowest; this is utilized to determine how and where water flows through the course (mountains are directly above this image. Close inspection also indicates drainage areas.
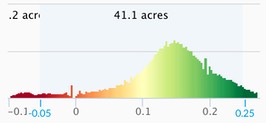
NDVI (Normalized Difference Vegetation Index) – Red refers to least healthy, dark green is highest with most reflectance. However, notice that many of the red spots line up with shadows where there was little reflectance, so these are not necessarily damaged areas.
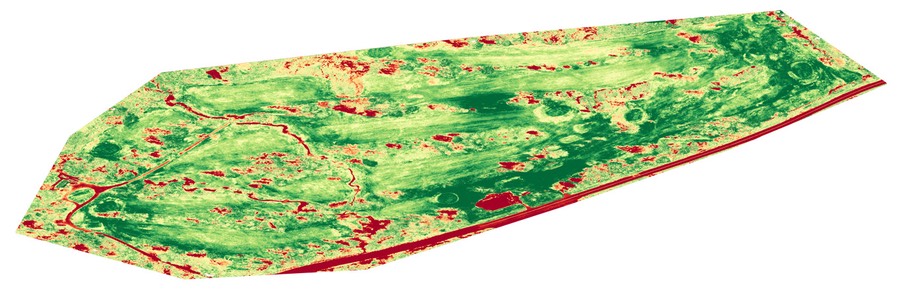
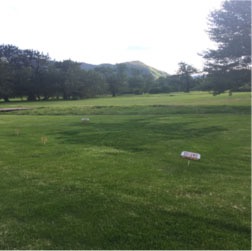
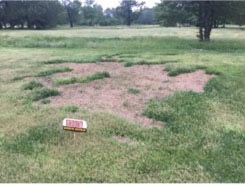
Example NDVI Treatment Area 13
This treatment area was completely dead – showing sand and volcanic ash less than one year ago, and was roped off as Ground Under Repair (see photos below. Following NanoAg treatment, the grass root structures are rejuvenated and growing strongly without other treatment. The dark red areas indicate dry streambed, and wooden bridge. The area marked below is approximately 100 sq.ft. and was dark red 10 months ago.
Treatment Area 13
Damaged Area 13 before and after treatment.